By Amelia Federico Soft skills. Durable skills. Essential skills. Core skills. Whatever you call them,…
Making our mark on the map: expanding geographic reach to serve more students
At Colorado Youth for a Change (CYC), we’ve referenced our growth over the past few years in blog posts and in discussions both internal and external about our programs. But what does that growth actually look like geographically?
Last school year, we delivered our five programs across 31 Colorado school districts in partnership with 6,784 students. This is an 186% increase in students served compared to the 2019-2020 school year.
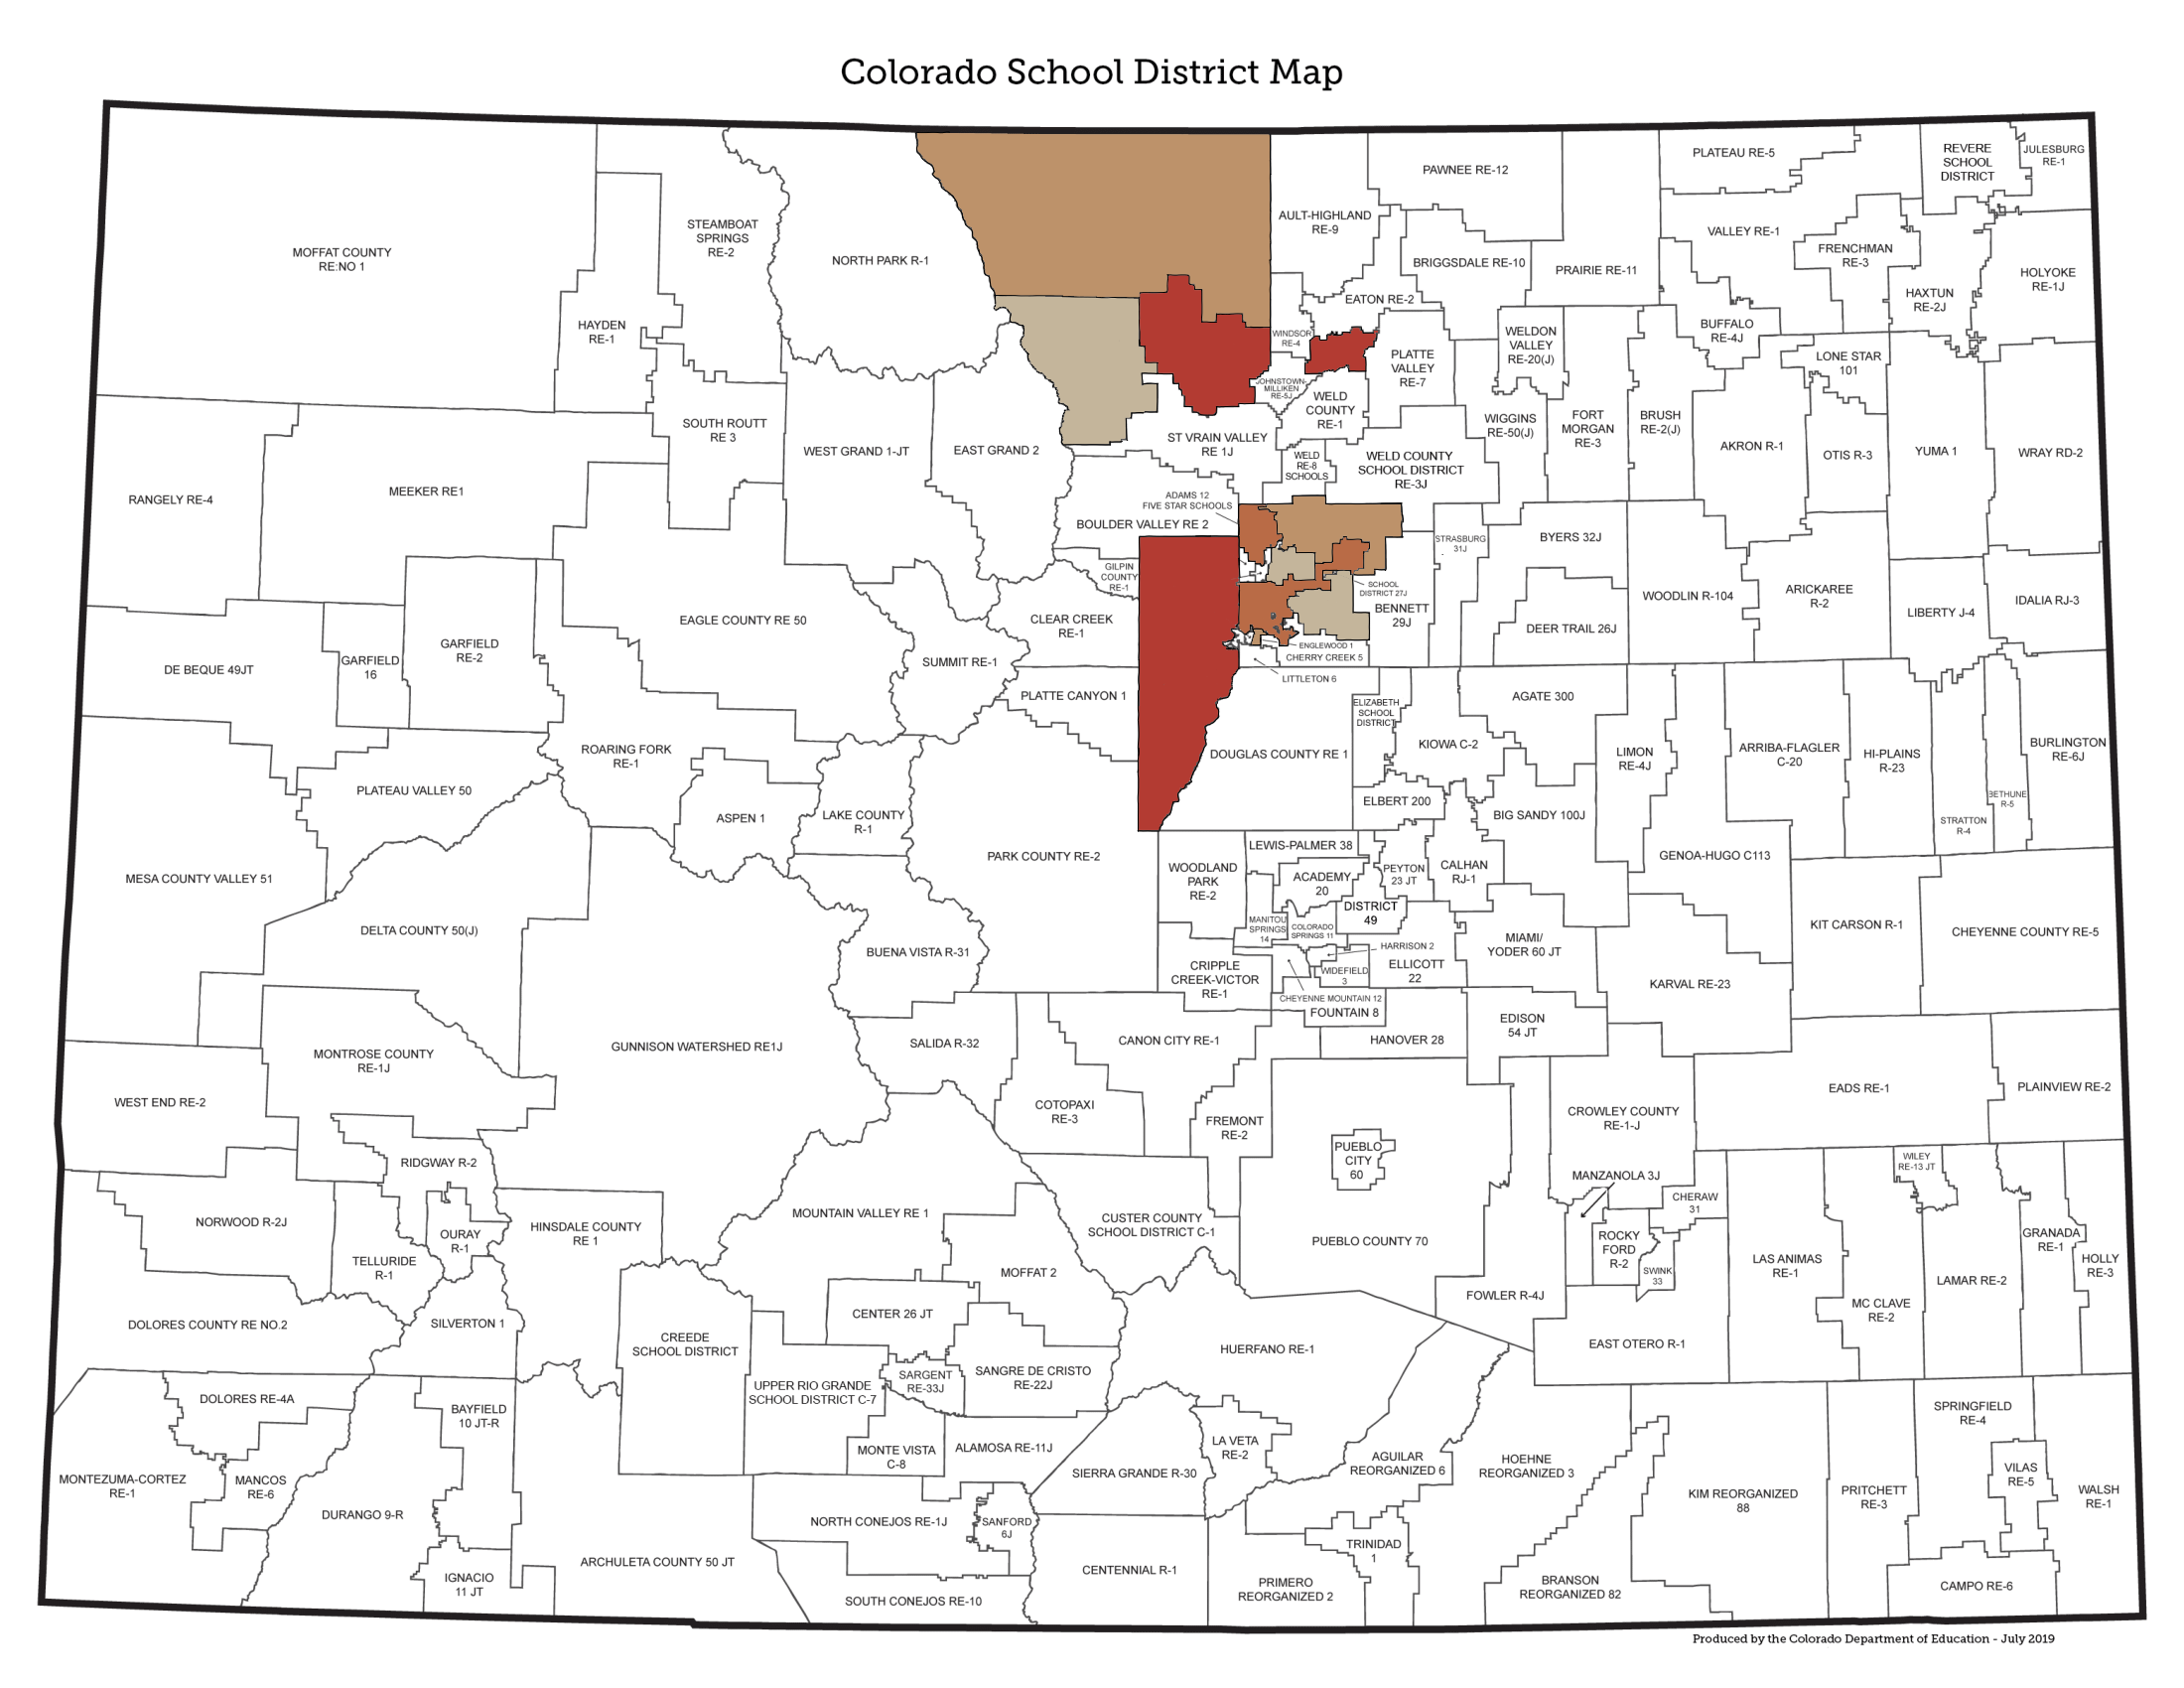
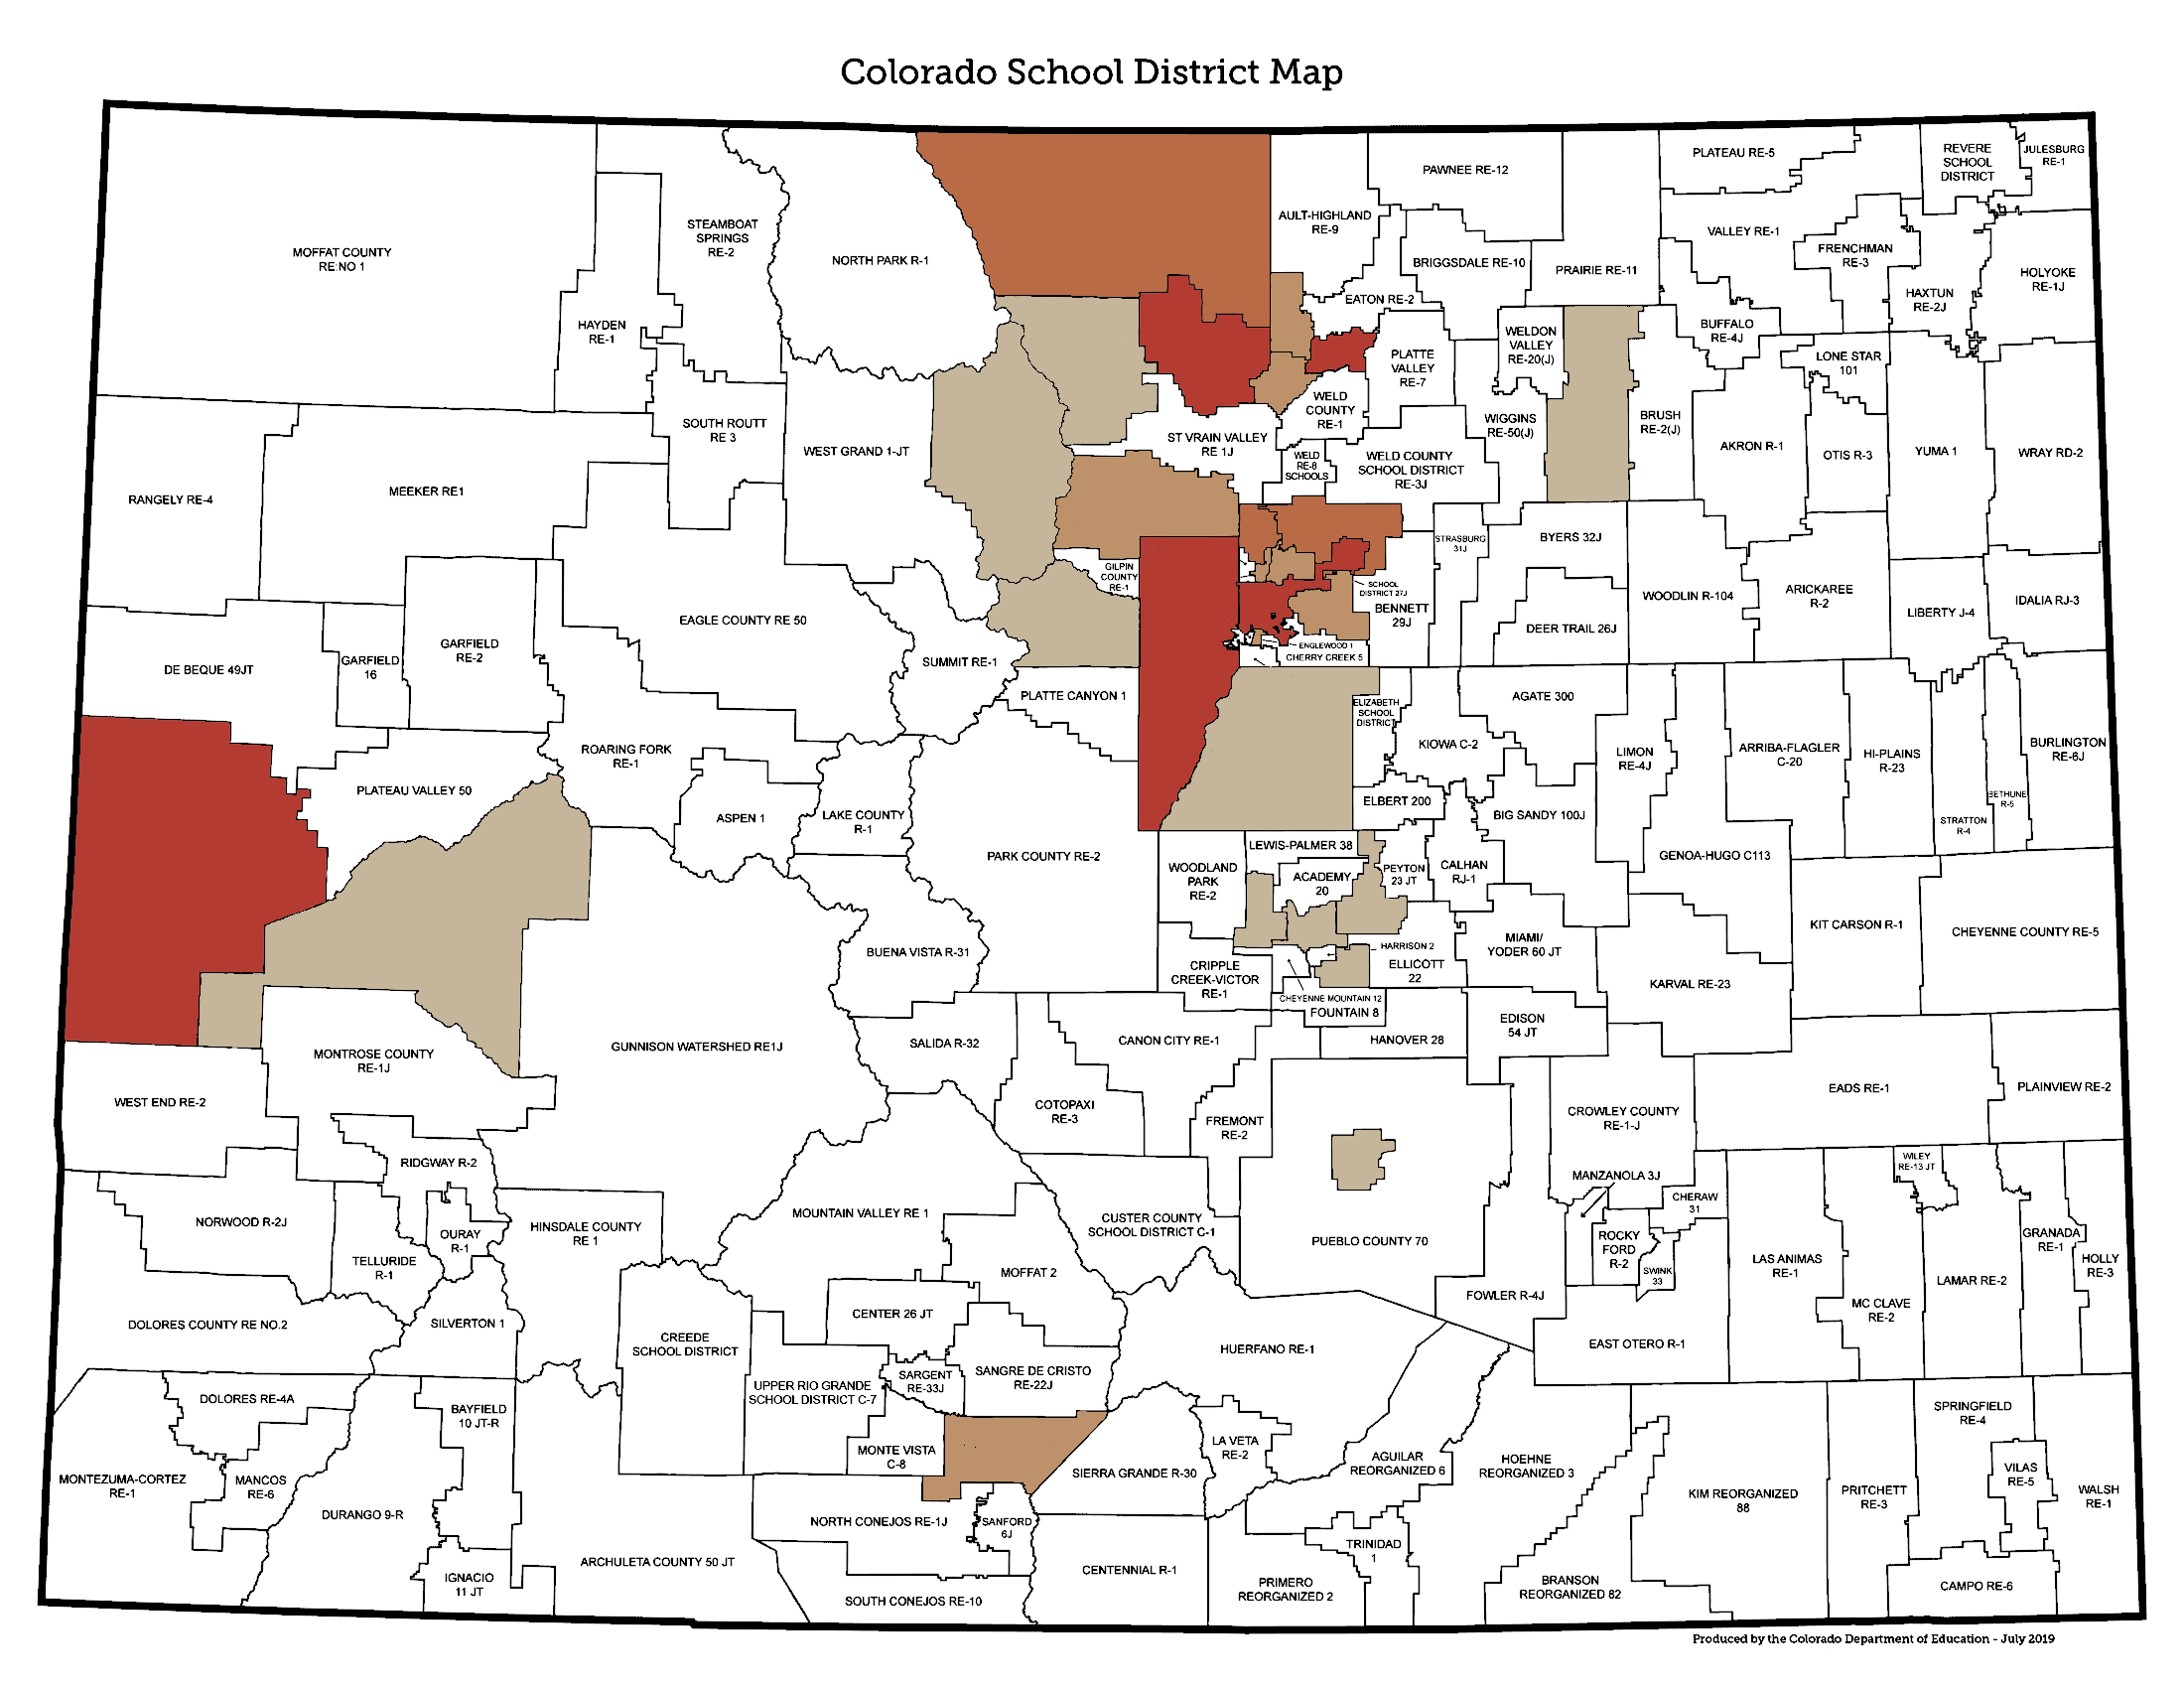
Numbers can seem heady when written out, so here is an interactive visualization that captures the growth of our geographic footprint over the past four years. Drag the arrow bar in the center back and forth to compare school sites served in 2019-2020 versus 2022-2023:
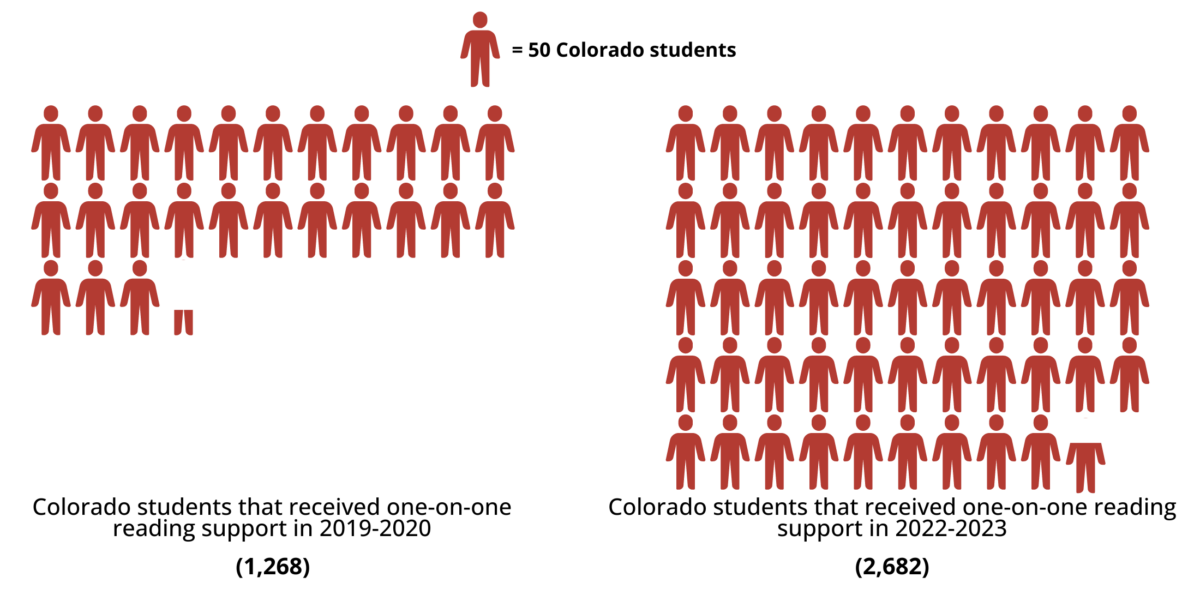
Our largest programmatic growth has been with Colorado Reading Corps in support of boosting early literacy with kindergarten through third grade students. We have more than doubled the number of students served at a time when education officials are especially concerned about gaps in reading caused by the pandemic:
Meeting the Need
Three of our programs (Early Learning Corps, Reading Corps, and Math Corps) are nationally replicated, evidence-based programs and are designed to serve students not meeting benchmarks in early literacy and numeracy, grade-level reading, or grade-level math. Students from low-income families (defined by the state as families that qualify for free and reduced lunch) face unique challenges, especially in light of the disruption caused by the pandemic. As Chalkbeat Colorado reported, “Colorado continues to have major gaps in proficiency rates based on student economic status… The gaps between students living in poverty and their more affluent peers is more than 30 points in most grades and subjects.”1 Last year, CYC delivered Reading Corps and Math Corps in districts that have some of the highest percentage of low-income students, such as Adams County 14 (81.8% of students are low-income, third highest in the state out of 171 districts) and Greeley-Evans School District 6 (64.5% of students are low-income, 21st highest in the state).2
It has also been encouraging to see positive trends in graduation rates, particularly where we deliver Corps for a Change, our high school AmeriCorps program that supports students who are chronically absent. For example, School District 27J (located in Brighton) achieved one of the largest two-year increases in graduation rates in the state, going from a graduation rate of 86.2% to 90.9%.*3 Of course, the district deploys a number of initiatives and programs to boost attendance and combat absenteeism, of which Corps for a Change is one; 103 students across 3 high schools in 27J received one-on-one attention and support from a CYC AmeriCorps member last year.
Spotlight on our largest district: Denver Public Schools
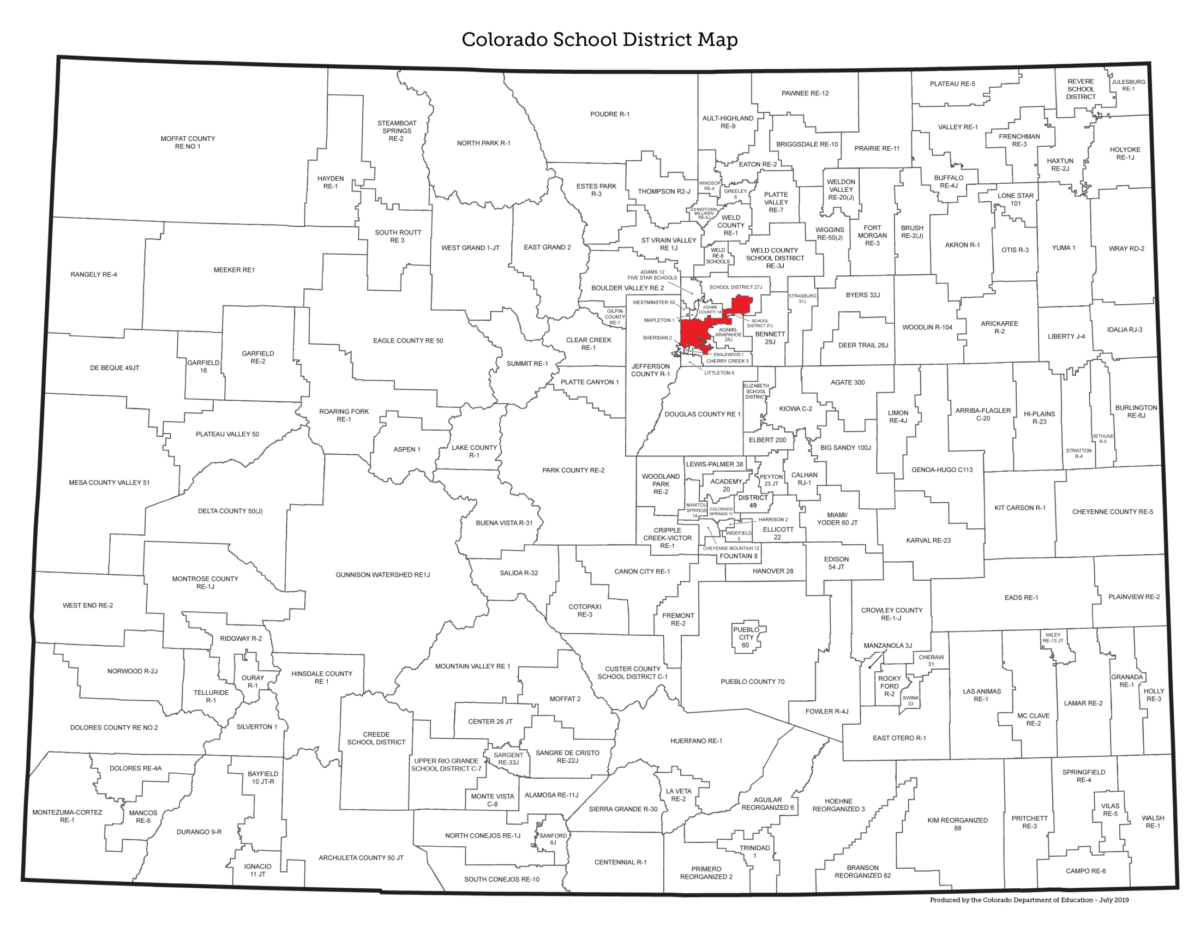
Unsurprisingly, Denver Public Schools (DPS) is the largest (by enrollment) district that Colorado Youth for a Change serves, with an enrollment of 87,864 students. Last year, CYC served 690 of those students with one of our AmeriCorps programs. Our Reengagement program also provided personalized outreach to reenroll in school to 2,000+ additional students. Here is a snapshot of our impact in DPS last school year:
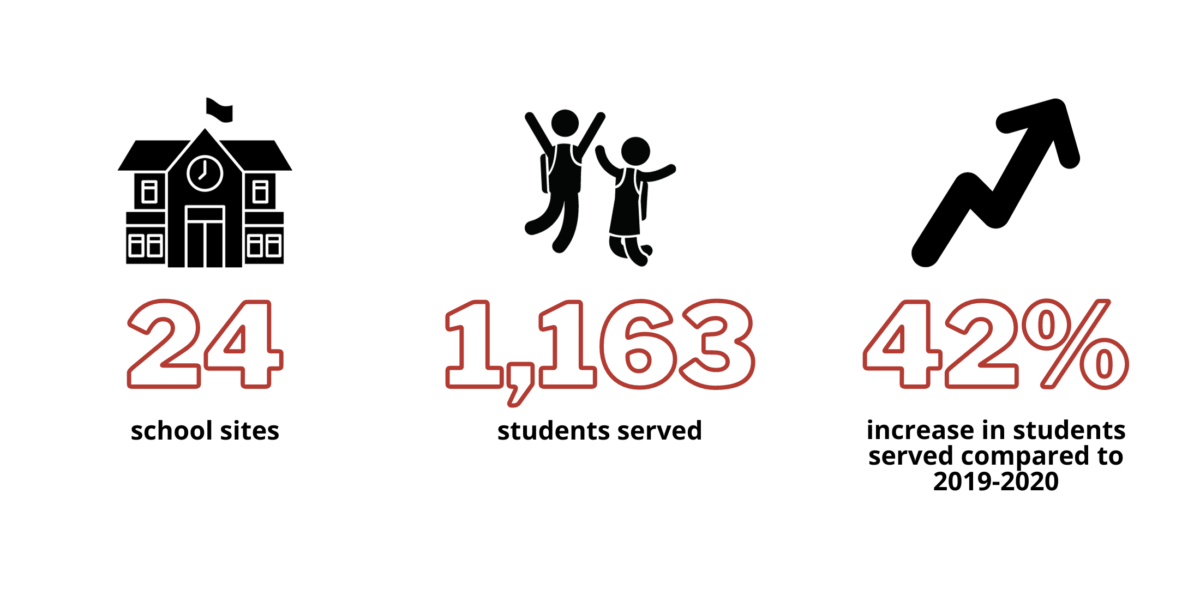
When asked about our Corps for a Change program, a staff member at a school site in Denver Public Schools said, “The impact of having a Corps for a Change member at our school is being able to provide more direct support to students on the edge of either succeeding or ‘disappearing.’ The AmeriCorps member ensures that these students have a person who regularly checks in, clearly is invested in their success, and will work to help the student overcome obstacles to being in school.”
The impact of having a Corps for a Change member at our school is being able to provide more direct support to students on the edge of either succeeding or ‘disappearing.’
–school staff member in Denver Public Schools
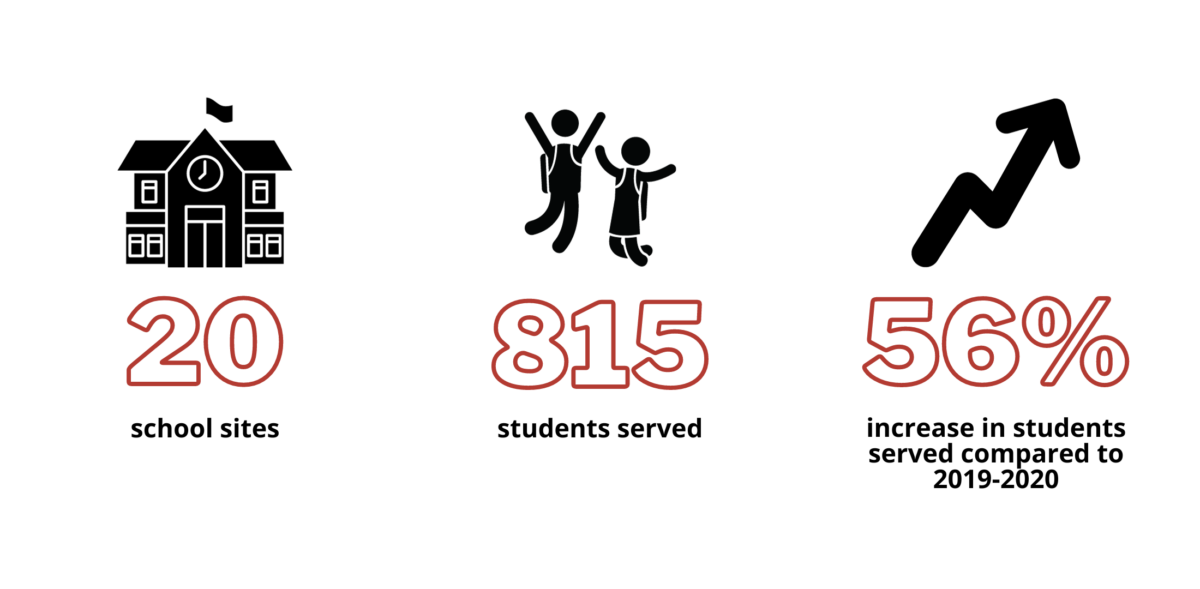
Spotlight on our “middle” district: Thompson School District
Falling directly in the middle of the districts we serve (in terms of student enrollment) is Thompson School District, which serves 15,212 students in three counties northwest of Denver. Though it is smaller than some of our other district partners, our partnership with Thompson runs deep. Last year, we delivered Reading Corps, Math Corps, and Corps for a Change in Thompson:
When asked about our Math Corps program, a staff member at a school site in Thompson School District said, “Math Corps has a huge impact on our math achievement. We have a number of students who have many holes to fill in their math development. This instruction has built confidence within our students and provided teachers with much needed support.”
[Math Corps] has built confidence within our students and provided teachers with much needed support.
-school staff member in Thompson School District
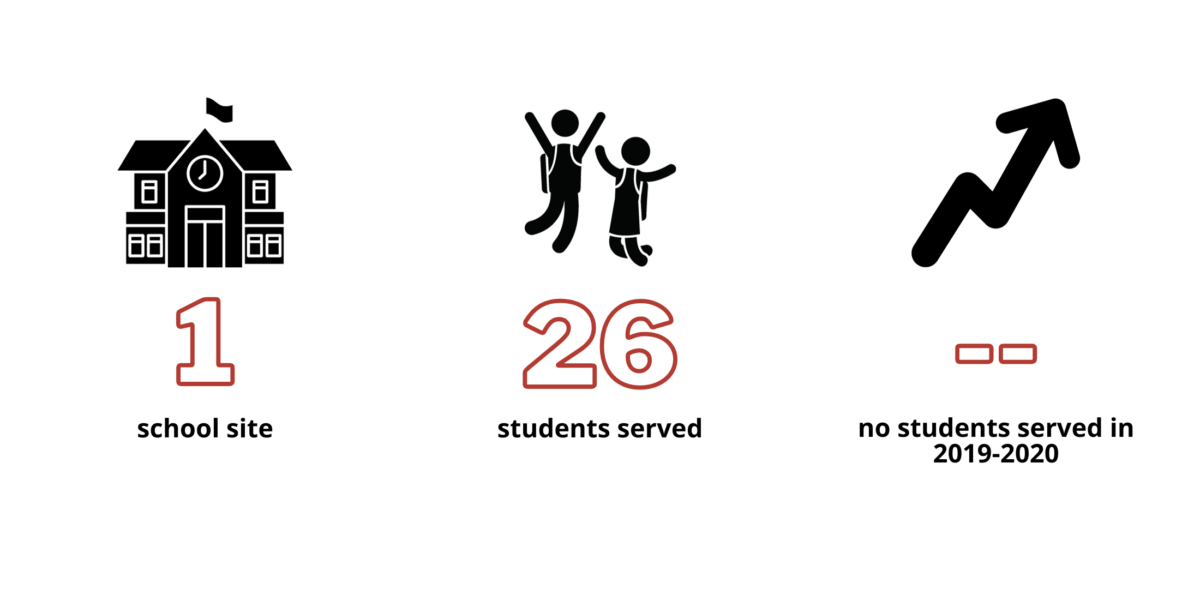
Spotlight on our smallest district: Clear Creek RE-1
Located west of Denver, Clear Creek School District RE-1 is home to 680 students—26 of whom we served with Reading Corps last year in our first year partnering with the district:
Across our Reading Corps program, student growth last year was equivalent to an extra 50%-90% of a year of schooling.
Looking Ahead
Many factors weigh into where and at what volume we deliver our programs, including AmeriCorps member availability, district interest, funding considerations, and more. As we continue to grow and evolve along with our students’ needs, CYC’s commitment remains the same: we will provide individualized supports to students across Colorado, with the ultimate goal of supporting students to maximize their own learning and growth.
Sources:
- https://co.chalkbeat.org/2023/8/17/23835415/colorado-2023-cmas-results-show-slow-academic-recovery-red-flags-for-some-students
- https://www.cde.state.co.us/cdereval/pupilcurrent
- https://www.cde.state.co.us/cdereval/gradratecurrent
*While most of this article references 2022-2023 data in comparison to 2019-2020 data, the dropout and graduation rate data for the 2022-2023 school year will not be available until late this year. We are referring in this section to data from 2021-2022, which is the most recent data available.